Going past the fundamentals, technical analysis is where most binary option traders will be able to generate advantages large enough to increase their win-rate sufficiently so that they land in profitable-territory. It is no small feat to accomplish (on most trade-types, the win-rate will have to be in excess of 56-60%), but it can indeed be done and the strategy I’m about to discuss below is one potential tool that will help you get there. Technical analysis is about chart patter-recognition. This is indeed 90% of the work involved in these strategies, because once properly identified, chart patterns are quite self-explanatory when it comes to placing the actual trades they “call” for. This axiom is doubly true in the case of the rounding pattern, which we will use to trade the Call/Put and Touch/No Touch contracts in a profitable way, obviously.
What are the rounding patterns, how do we spot them and what do they mean?
Rounding patterns fall into two basic categories: rounding bottoms and rounding tops. A rounding bottom pattern is defined by a curved trace, which links the successive bottoms of candlestick lows. By extending this trace in a symmetrical way, the person doing the technical analysis will get a saucer-shaped curve, which is the rounding bottom pattern we’re looking for. By definition, the critical points which define our rounding bottom are at a series of minor support levels, which follow an initial support which we use as the starting point of our rounding bottom. The trace has to touch at least two such candlestick lows in order to hint at a developing rounding bottom.
All the above-said are valid for rounding tops as well, only in this case, the pattern we’re looking at is an upside-down saucer, and it is defined by a series of successive resistance levels. For all practical purposes though, it is identified the same way the rounding bottom pattern is.
Back to our rounding bottom though: once the trace is drawn up and the pattern is indeed confirmed, the curve will act as a solid support and the trader can expect all later asset-price action to bounce right back off it. The shape of the rounding bottom trace also points at a complete reversal of the trend that was dominant when the rounding bottom shape began to form.
With all the above said in mind, for most traders, it should be clear how these rounding patterns can be traded both through the use of the Put/Call contract and the Touch/No touch one. To make that even clearer, let’s sum up all the above: the presence of a rounding top or a rounding bottom pattern – when confirmed – means that a trend reversal is about to happen. Rounding top patterns point to the reversal of a bullish trend into a bearish one, while rounding bottoms mean a bearish trend is about to morph into a bullish one.
Following the identification of the rounding top/bottom pattern, before the actual trades are placed, the trader allows the price-action to bounce off the firm support/resistance curve defined by the saucer-shaped trace, just to gain additional confirmation that the pattern does indeed hold water. While for trend-reversals, the stochastic oscillator usually makes a superb conformation-tool, in this instance, its usefulness is rather limited, due to the multitude of various signals that it will end up generating through the price-action period covered by the pattern.
How do we trade then?
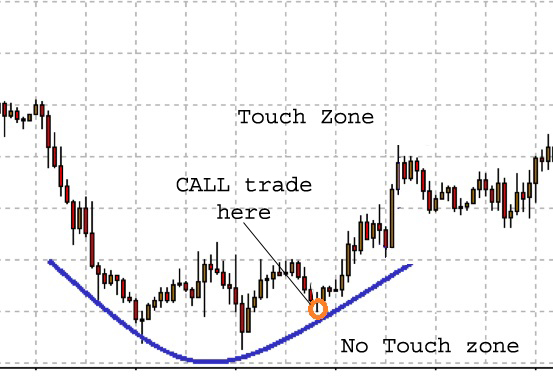
As said above, after the saucer is drawn up, the trader allows for two bounce-backs and then enters a CALL trade right where the second bounce-off is (in the case of a rounding bottom of course). If we’re dealing with a rounding top pattern, a PUT trade is entered at the second bounce-off. The finesse of the trade consists in the proper setting of the expiry: we need to allow the trend plenty of time to run its course, so the expiry on this one will be quite generous. If the analysis is done on an hourly chart, the expiry has to be set to about 4 hours.
The trading of the Touch/No Touch contracts is even more straightforward. The saucer-shaped trace that we drew up also acts as the boundary between the Touch and No Touch zones. In the case of a rounding bottom for instance, the reversal is a bullish one so the price goes upwards, which means the Touch zone is above the saucer, while the No Touch one is below it. In the case of a rounding top though, the Touch Zone is below the saucer, and the No Touch zone is above it. That pretty much points to how the trades should be placed.
Looking at a rounding bottom: starting off the point where the CALL trade was placed in the above scenario, we place the Touch trade about 30 pips above that point. In this instance, the expiry has to be extremely generous indeed: it has to be set to a minimum of 48 hours. It also pays to be generous with the expiry in this case because the nature of the Touch option simply justifies it.
Given how the asset-price is set to head back upwards after the bottom of the saucer, it makes perfect sense to place the No Touch trade some 30 pips below the bottom of the saucer. The expiry can be more generous this time too: 12 hours will suffice, since it’s quite obvious that the asset-price should not hit that target any time soon.
The trading manoeuvres work in a similar manner with a rounding top pattern too. The difference is that the Touch trade goes below the saucer and the No Touch one goes above it in that instance.
The strategy is efficient and in the right hands, it is indeed profitable too. The problem is though that the recognition of the pattern is quite a bit more difficult than just understanding how the whole setup works. It is therefore advisable for rookie traders to put it to the test through a demo account before using it in real money trading.